Using the risk matrix from the last chapter, leaders can identify high-frequency, high-impact problems and decide where to act first. If footprint mismatches are the biggest recurring issue, they deserve early AI checks in design review. If review bottlenecks slow releases, then asynchronous review aids and automated checklists become the tactic. The matrix is just the bridge. The real progress comes from execution.
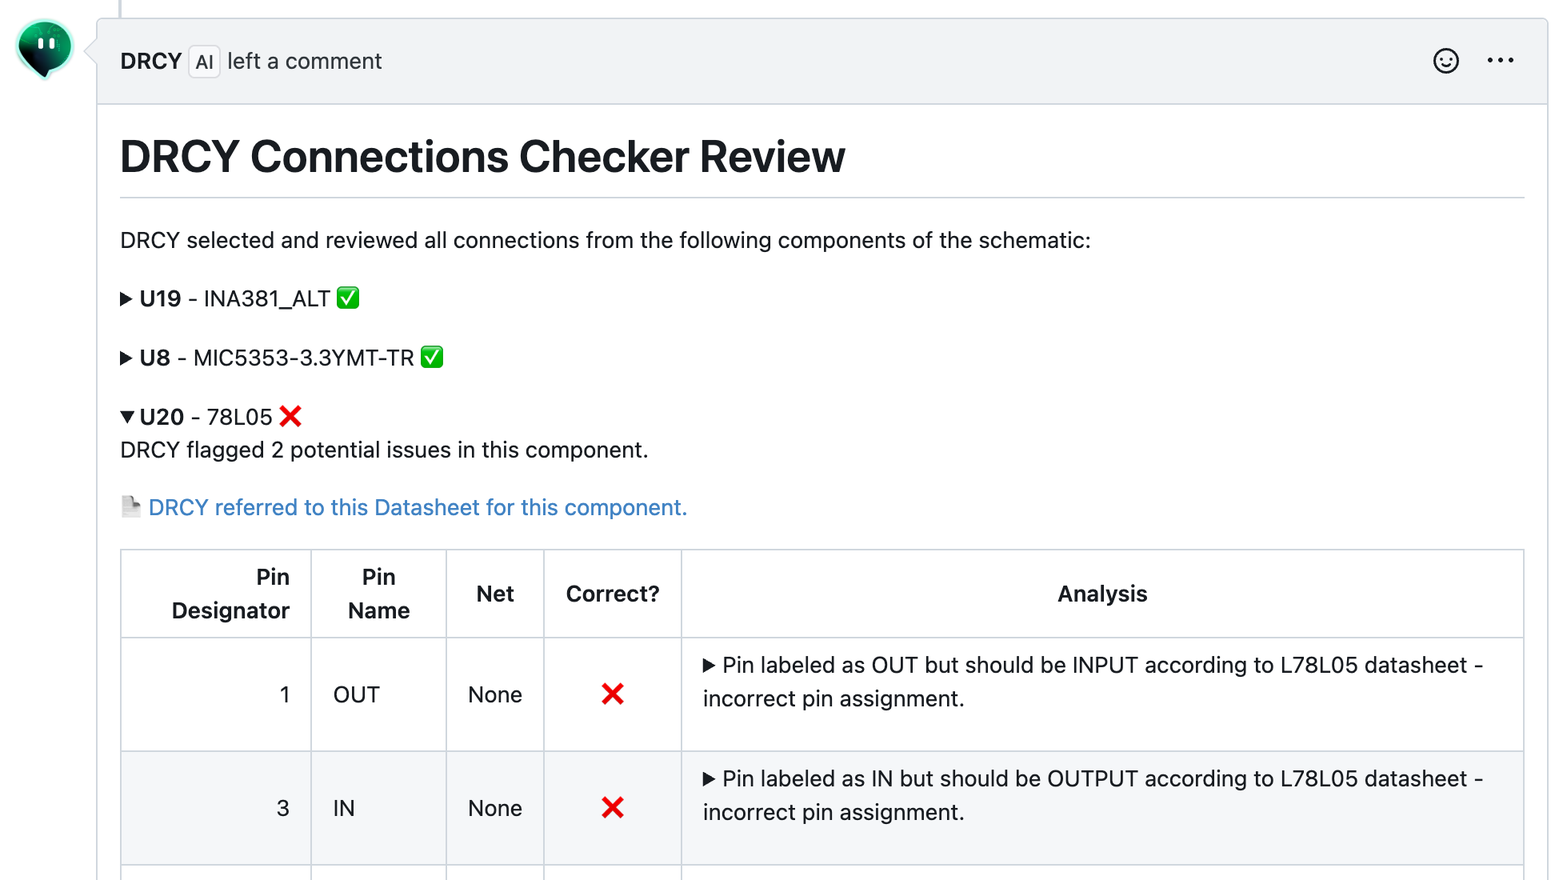
What matters most at this stage is implementation. Applying AI in engineering workflows should not add risk; it should remove it. The most effective rollouts start small and grow. Teams begin with repeatable, low-risk tasks, BOM validations, schematic-to-datasheet cross-checks, or auto-generated review comments.
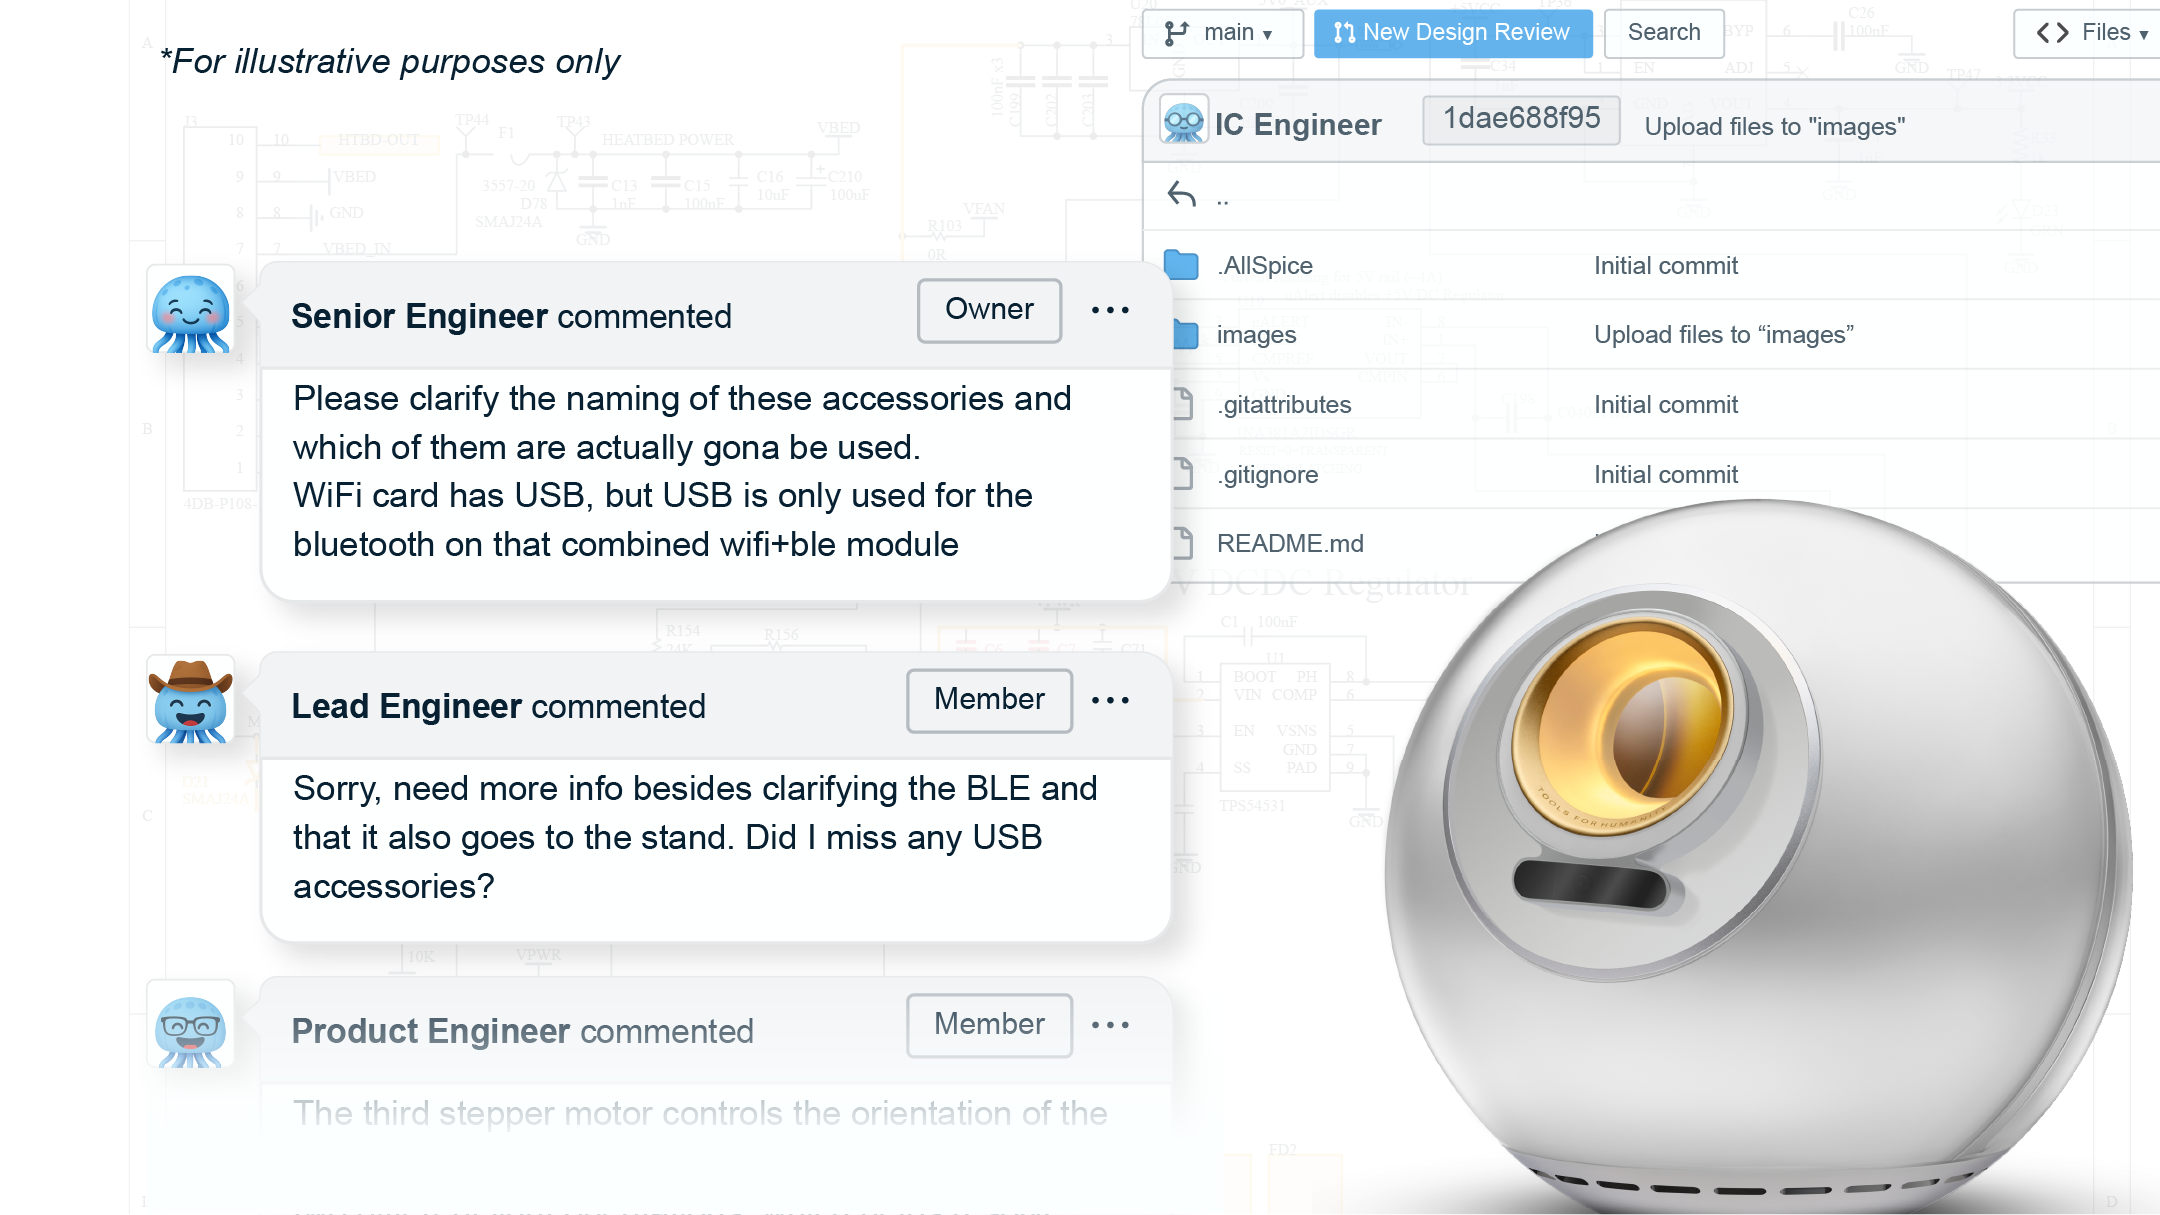
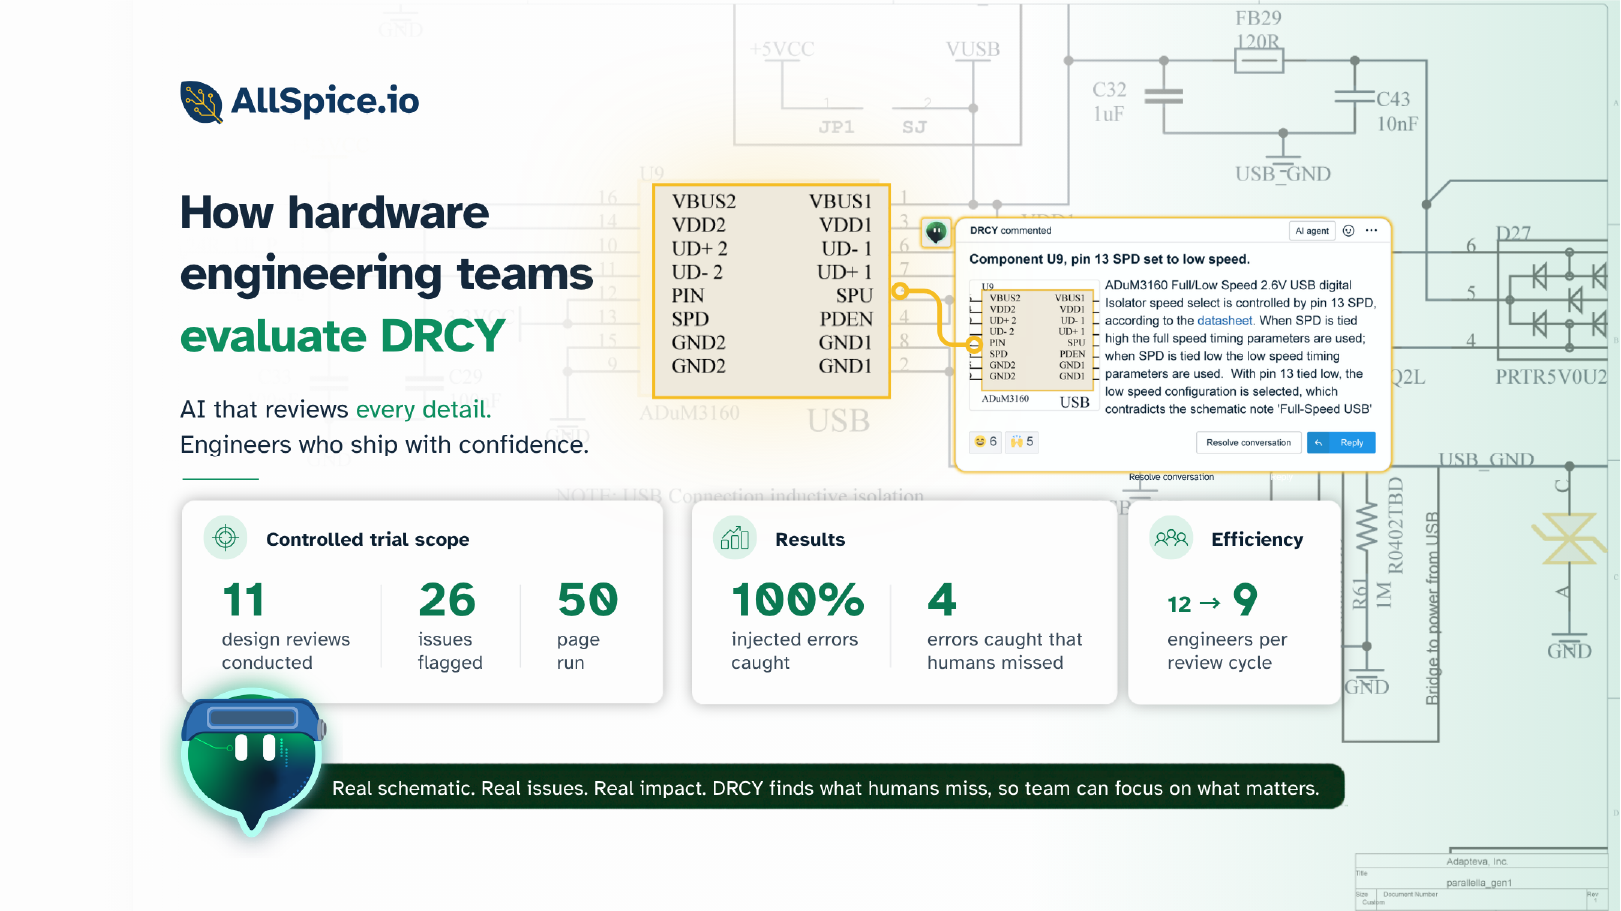
They integrate these into existing Git-style processes instead of layering on new tools. And they measure impact with hard data: review turnaround time, defect discovery stage, and late-stage issues caught earlier.
The boundaries must be clear. AI is not a simulator, nor is it a live CAD plugin. It won’t replace thermal analysis or layout engines. What it can do today is flag risks, extract and validate datasheet values, lint design files, generate test scaffolds, and enforce consistency. It works like a linter in software: catching obvious issues early, while leaving complex decisions to engineers. Keeping humans in the loop ensures responsibility and judgment remain with the team.
Different roles see the value of these tactics in different ways
Vicky, VP of hardware engineering
Vicky oversees budgets and delivery timelines for her organization.
“If I can see respins dropping and schedules holding, I know this is more than a technology trend, it’s a return on investment.”
Mei, electrical engineering manager
Mei spends more time coaching her team than designing boards.
“The rollout has to feel manageable. If engineers see AI as another burden instead of a tool that helps, I’ll lose buy-in right away.”
Paul, hardware engineer
Paul focuses on his own design quality and collaboration.
“If AI can catch power-ground mismatches or BOM errors before I push a board to review, that saves me time and keeps my colleagues from chasing the same mistake twice.”
Eric, director of engineering efficiency
Eric evaluates tools based on performance data and process improvements.
“My role is to show leadership where the efficiency gains are happening. That means I need adoption metrics, review latency numbers, and proof that fewer errors are making it into late testing.”
General-purpose AI tools can already help teams draft test scripts, summarize design diffs, and validate attributes against datasheets. But without infrastructure like ECAD-native diffs, review gates, CI pipelines, and audit trails, these gains plateau quickly. Off-the-shelf tools provide a start; specialized platforms reduce risk and make the results scalable.
A disciplined rollout ensures those results stick. In the first 30 days, teams pick two or three use cases, baseline the metrics, and stand up checks in a pilotrepository. In the next 30, they expand to more teams and add PR-gated AI checks. In the final 30, they formalize policies, publish ROI readouts, and set a consistent definition of done that includes AI support. The goal is to prove outcomes with dataL reduced respins, fewer reviews, and more predictable schedules.
Strategy sets the destination. The risk matrix shows the map. But it is the tactics; the daily habits, workflows, and guardrails, that get teams moving. Done right, AI becomes part of the rhythm of engineering work, not an experiment on the side.
Further reading
Five Metrics That Matter When Using AI in Test and Validation. NI’s article on what metrics (data quality, defect detection timing, consistency, etc.) test/validation teams should track to turn scattered measurements into decisions.
https://www.ni.com/en/perspectives/five-metrics-when-using-ai-test-validation.
How to optimize your AI tool rollout with data. A guide from getdx.com on starting with baseline metrics, measuring adoption & impact, identifying blockers,
and driving meaningful usage. https://getdx.com/blog/how-to-optimize-your-ai-tool-rollout-with-data/
AI Automates CAD Rule Checks for Vehicle Body Validation (Dessia casestudy). An example of a real engineering team replacing manual rule checking
(in CAD) with automated, traceable checks; large rule sets, consistency, reducing validation times etc.
https://www.dessia.io/case-studies/ai-automates-cad-rule-checks-for-vehicle-body-validation
Predictive Analytics in Testing: Leveraging AI to Forecast Defects. Article showing how AI can use historical test & code data to predict which modules/
areas are likely to fail, so teams can focus. See “defect discovery stage” metric, catching issues earlier in the pipeline.
30/60/90 rollout checklist
First 30 days
- [ ] Identify 2–3 high-frequency, high-impact risks
(e.g., footprint mismatches, BOM errors).
- [ ] Select a pilot repository and configure AI checks for those risks.
- [ ] Baseline current metrics: review latency, defect
discovery stage, rework hours, respin rate.
- [ ] Train pilot engineers on workflow changes (commit cadence, PR gates).
- [ ] Document guardrails: AI is advisory, not authoritative.
Next 30 days
- [ ] Expand pilot to 1–2 additional teams.
- [ ] Add PR-gated checks (automated BOM sanity,
footprint validation, async review suggestions).
- [ ] Publish first ROI snapshot: hours saved, early errors caught.
- [ ] Gather feedback from managers and ICs on usability and adoption.
- [ ] Begin internal comms: highlight early wins
and publish role-specific guides.
Final 30 days
- [ ] Roll out org-wide “definition of done” including AI checks.
- [ ] Add additional checks (e.g., datasheet validation,
test scaffolds, compliance templates).
- [ ] Harden CI/CD integrations and permissions.
- [ ] Publish a 60-day ROI report with before/after comparisons.
- [ ] Plan next quarter’s expansion: more teams, more checks, more metrics.
KPI dashboard spec
Purpose: Track impact of AI rollout on efficiency, quality, and ROI in terms that
leadership cares about.
1. Review latency
- Definition: Average time from Design Review submission to review completion.
- Business link: Faster reviews help hold release schedules.
- Goal: Reduce by 20–30% in 90 days.
2. Defect discovery stage
- Definition: Percentage of errors caught pre-HALT vs. during late validation.
- Business link: Shifting discovery earlier avoids costly test delays.
- Goal: Move 15% of late-stage issues into early-stage review.
3. Rework hours
- Definition: Engineer hours logged on rework or respin tasks.
- Business link: Less rework lowers cost and frees teams for innovation.
- Goal: 10–15% reduction in 90 days.
4. Respins avoided
- Definition: Number of board respins eliminated due to earlier catches.
- Business link: Avoiding one respin can save weeks of schedule and significant
cost.
- Goal: At least one major respin avoided per quarter.
5. Adoption rate
- Definition: Percentage of engineers actively using AI-enabled checks in
PRs.
- Business link: Adoption is the leading indicator of cultural buy-in.
- Goal: >70% by end of 90 days.
6. ROI snapshot
- Definition: Dollar value of hours saved + respins avoided vs. cost of
implementation.
- Business link: Demonstrates financial justification to leadership.
- Goal: Show positive ROI within first 90 days; update monthly.
.png)